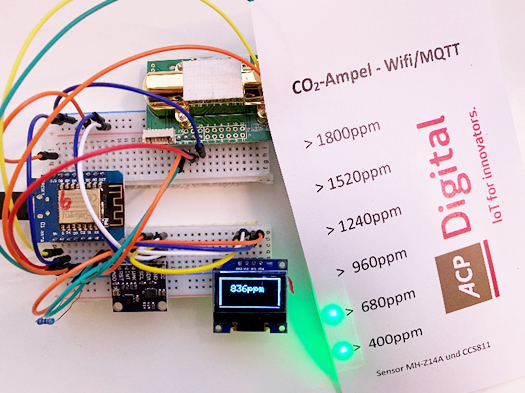
How to built you own CO2-Traffic light with node-red
with OLED Display, W2812, TLS enabled
As COVID-19 is now hiting us for a quite long time and will last for the next month I wanted to show my people around me how dirty is air.
I cannot find any sensor measureing the virus dust in the air but there are many sensors meassureing co2 and air quality which has a correlation to viruses flying around in our office rooms. Many colluges asking for opening the window because they have fear of getting the virus or because “the theacher” says so! In school the children are freezing because teachers are forced to open windows many times during the teaching hours but have no sense of closing the windows when it is enough. Now it is getting cold outside also the heating system has to fight against the theachers hold a good temeratur in classrooms. So my sensor can help out of many views. All together sustainability.
The main thing was to compile my own Firmware because there was no precompiled firmware with all my drivers included ;( So lets see how to compile your onw firmware of Tasmota online!
The solution looks like an easy job, buying some electronic sensors at your favorite china-platform and put things together.
Hm, no. Some sensors are really bad quality, many sensors are not doing the right job and you should know how to use them. Selecting the right library in your source code and putting things all together is also not an easy job, but i could manage it.
My Solution – things you need:
- Tasmota Firmware (of course) – download here
- ESP8266 Wemos Mini D1 – buy
- MH-Z14A CO2 Sensor (NIRD Method) – buy
- CCS811 Sensor – buy
- BMP280 Sensor (Temp/Press) – buy
- HDC1080 Sensor (Temp/Hum) – buy
- OLED Display with 64×128 pixels – buy
- W2812 RGB LED Stripe for Traffic light colored display – buy
- node-red – Calculation and Dashboard
- Azure IoT Central
Bring data from the device to your local MQTT-Broker
device -> MQTT (Wifi) -> Broker -> node-red
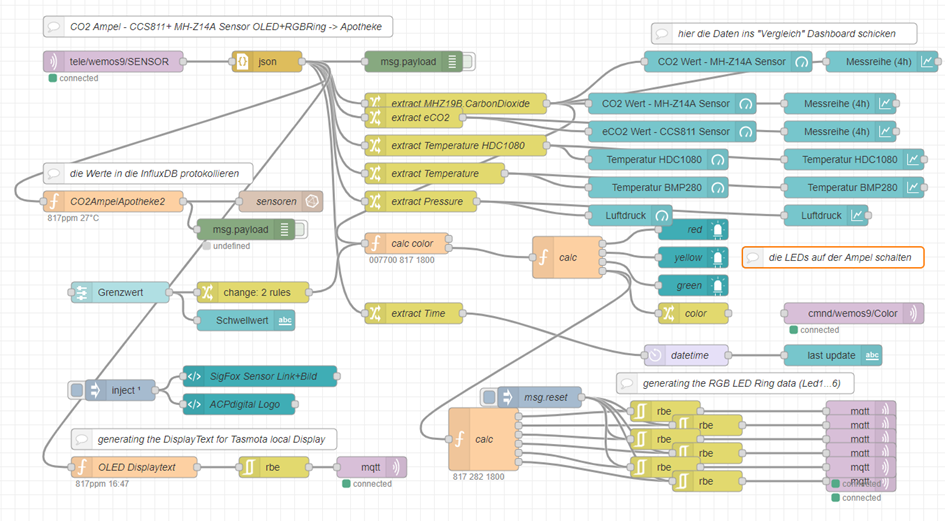
There are many nodes and i understand that is not very nice but it grow and i did rearrange the nodes itself 😉
Let’s start on top left to the right:
- MQTT in – that brings the data in from the Broker
- Filter to a specific Attribute – eCO2 Value
- Gauge – sho the Single Value at the Dashboard
- Chart – show the Values as an timeseries at the Dashboard
- function node – prepar an object to store in influxdb
- influxdb – store the data for later use and Grafana Dashboard
on the right bottom – calculation for LEDStripe
- function node – here i calculate the LEDStripe which Led of the stripe should show which color of light, so the level of CO2 in the Air is shown
- rbe – dont send if nothing changed – less traffic
- MQTT out – send out the command that the right LED is showing the right light
on the left botom – calulation for the OLED Display
- function node – setup the command for the OLED Display, so the command for Tasmota as a sample
DisplayText [zx0y0r128:64x2y2r124:60f0c3l2s2]508ppm [f0c5l6s1]18:45:00 29.1 C
that command sends a rectangle and an big letters CO2Level and a small letter clock and temperatur vaule
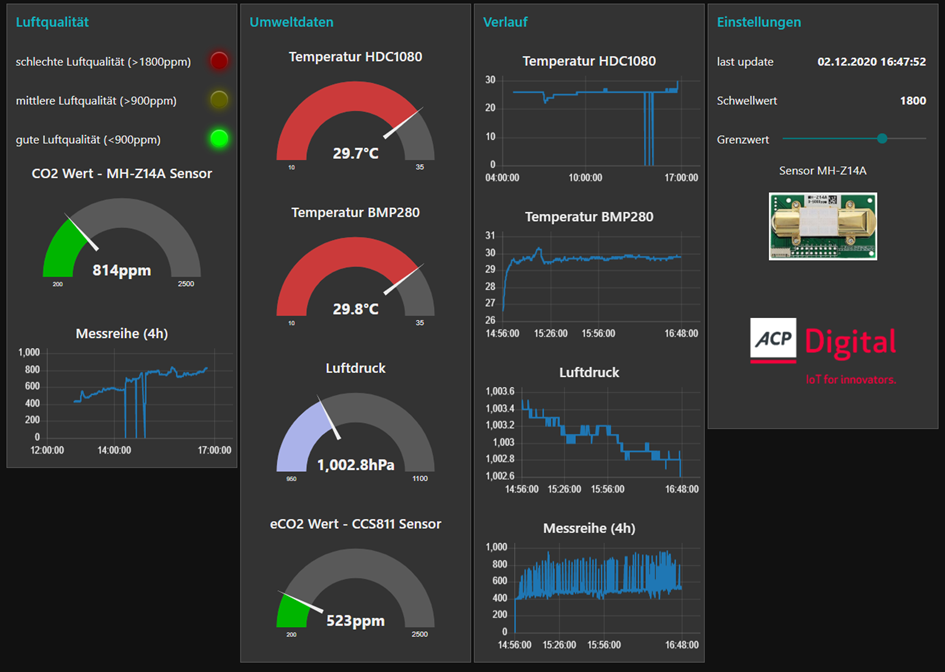
My node-red Dashboard
Here are some Screenshot of my node-red flow which i publish separatly:
and finally my dashboard in node-red:
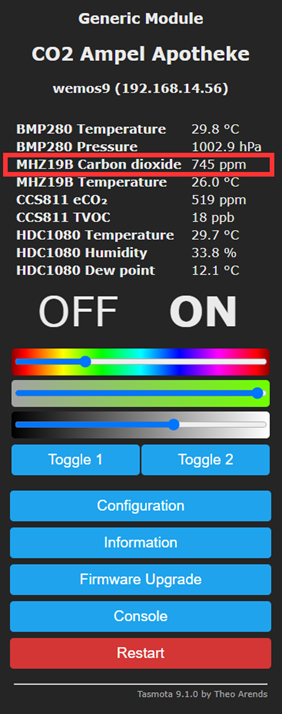
This is the built-in Website of the sensor itself coming from Tasmota – the color sliders are because there ie the W2812 RGB-Ledstripe connected which i use direct per LED with the command “LedX FF0000”:
You can read more about the node-red stuff here!